
Customer churn analytics
Understand Customer Churn Through Purchase Data
If your customers don't cancel a contract, they just stop ordering, and churn hides in plain sight. Revenow measures it directly from your transaction history so you can see its size, its cost and where it starts.
Churn Without a Cancel Button
Subscription tools can count cancellations. Most stores, distributors and service businesses have no such event: a customer simply doesn't come back. Without analysis, that loss only shows up as slower overall sales, with no names attached.
Churn Indicators vs. Verified Churn
Good churn analytics keeps two ideas apart:
- Churn indicators are early signs. In Revenow, a customer with 60 to 89 days since their last purchase is at risk.
- Observed churn is a customer who has passed the inactivity threshold: 90 days or more without a purchase.
Both are measured relative to the analysis reference date, with the same rules (Generic 1.0) for every customer. Revenow does not run a predictive churn model and does not guess individual buying cycles.
Why Measuring Churn Matters
A churn rate on its own is just a number. Tying it to real customers and their past spend tells you whether you are losing a few small buyers or a handful of accounts that carried the business.
How Revenow Analyzes Churn
- Upload a CSV or XLSX export of orders or transactions.
- Revenow groups orders by customer and measures the days from each last purchase to the analysis reference date.
- Customers are sorted into active, at-risk and inactive.
- Inactive customers get an estimated recoverable revenue; at-risk customers an estimated revenue at risk.
- Opportunities are ranked so you know where to start.
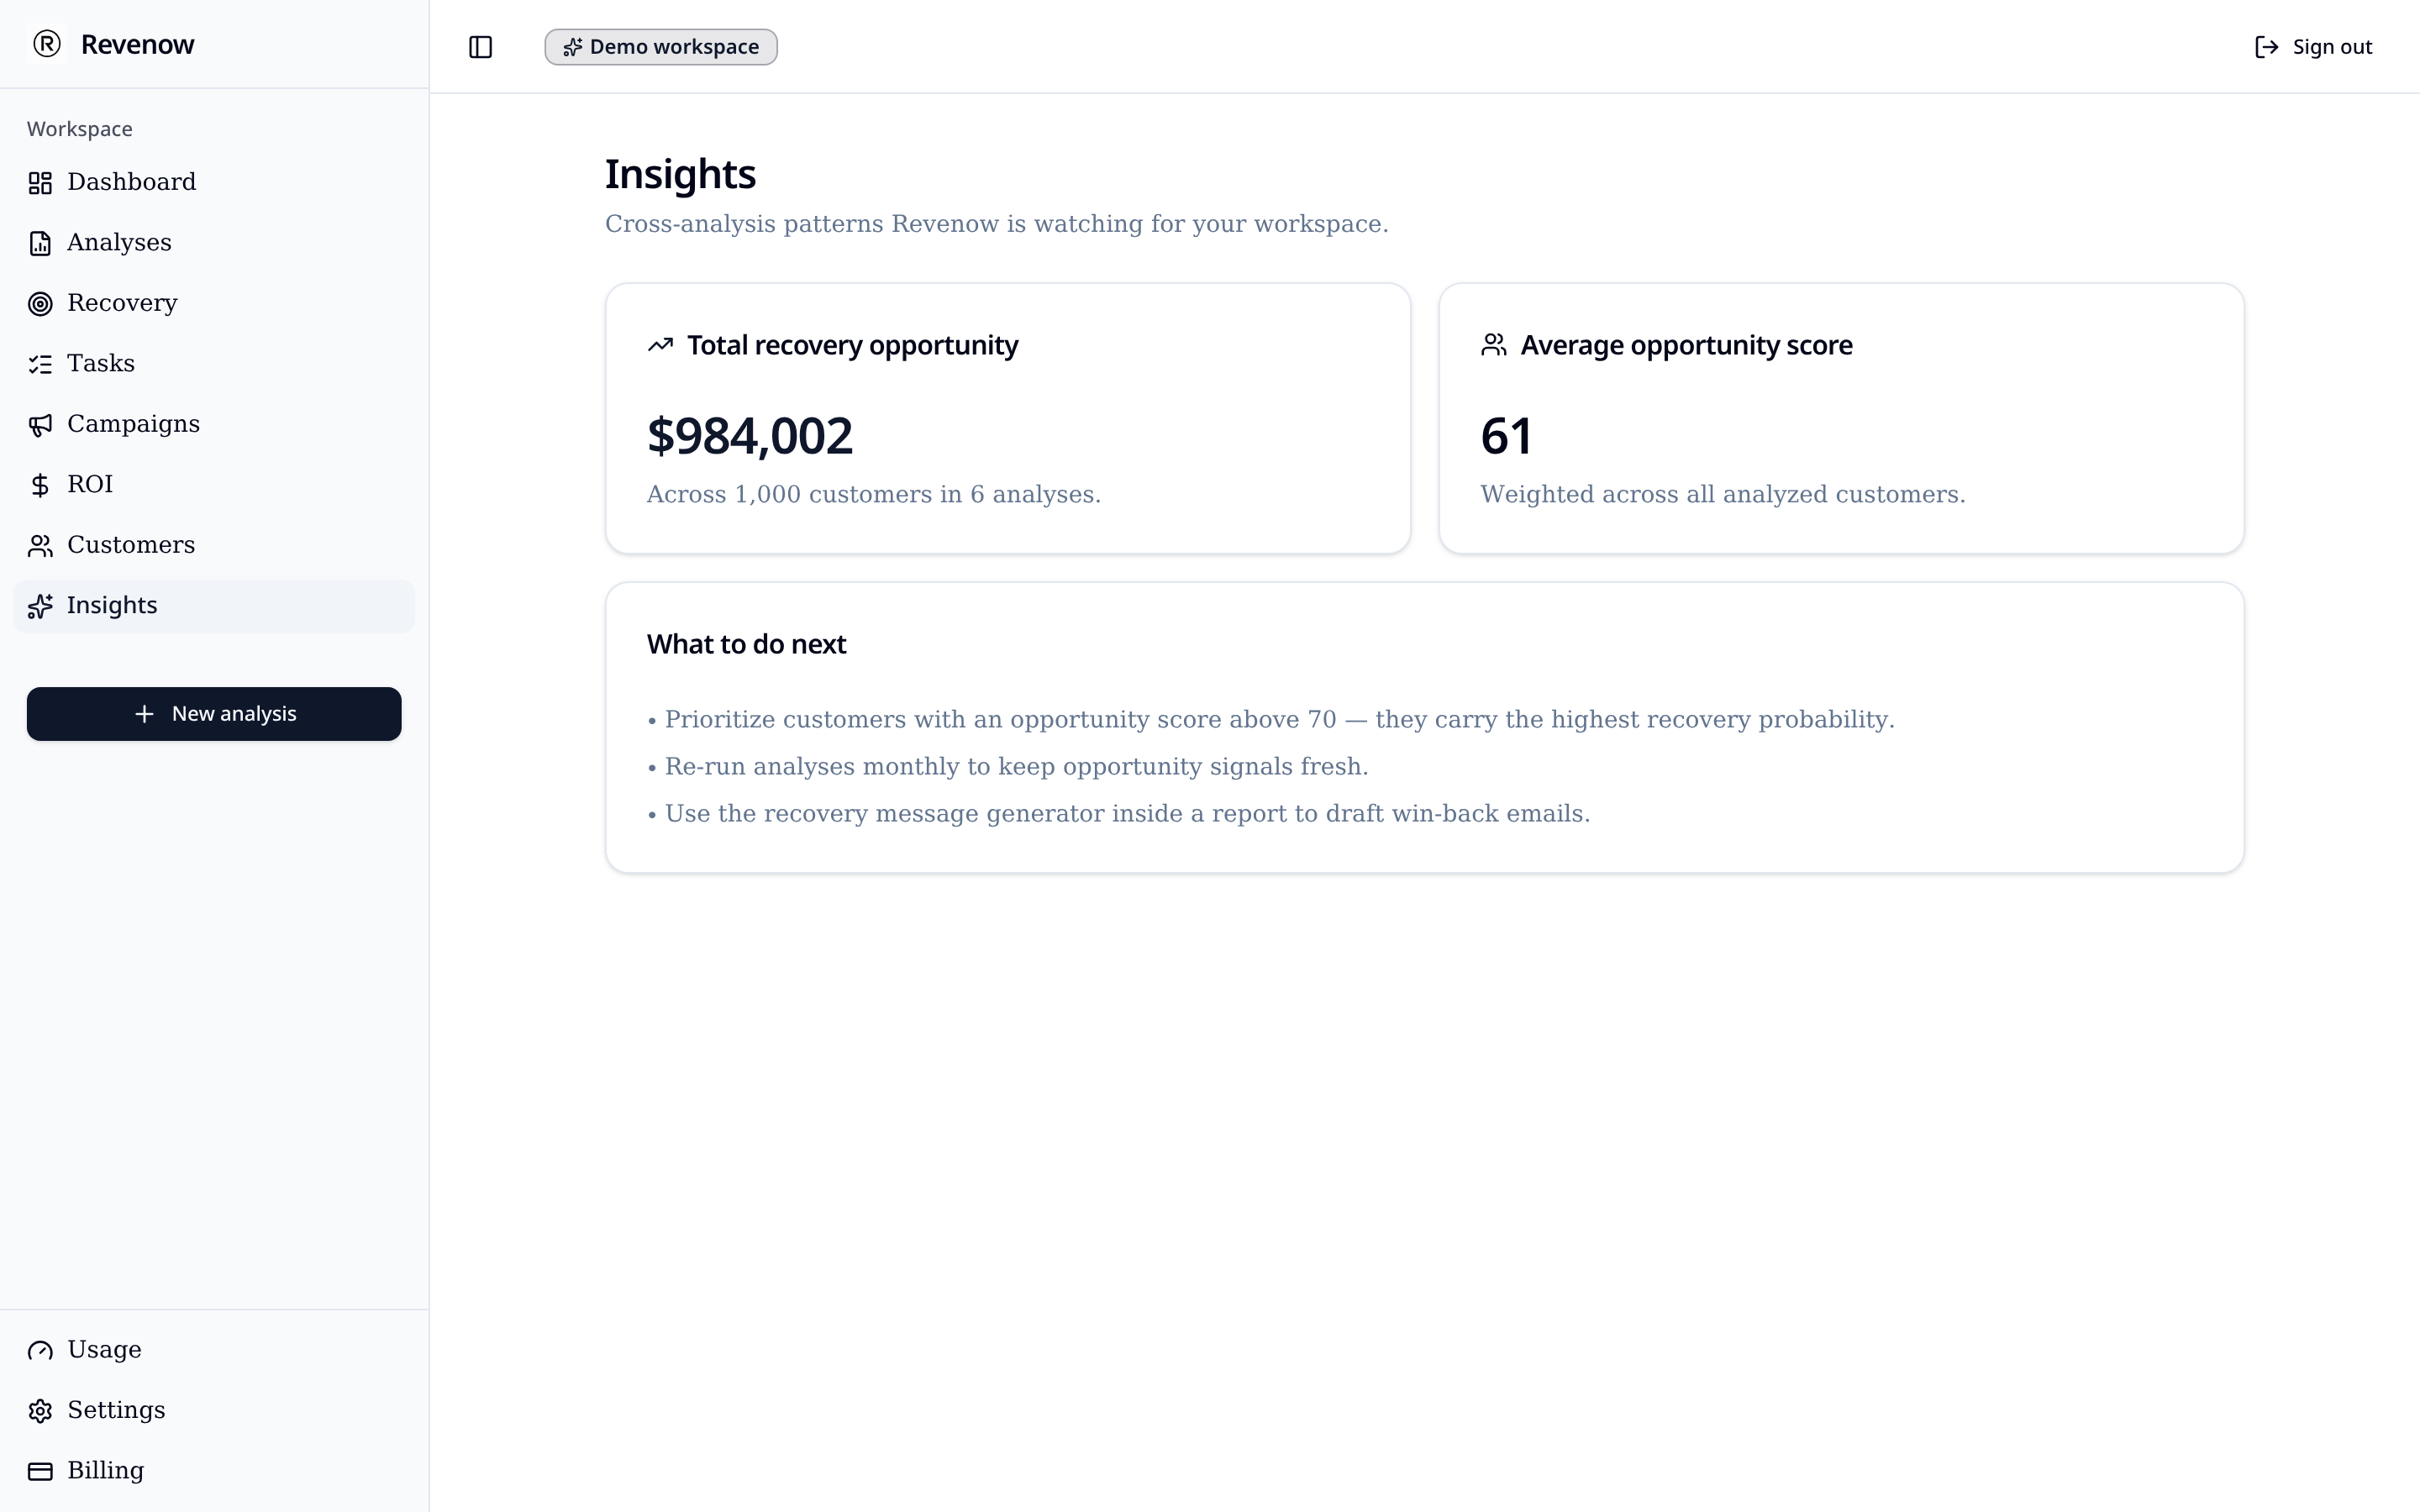
Example: Reading a Churn Snapshot
Illustrative example with hypothetical figures. Actual results depend on your data, and estimates are not guaranteed revenue.
A shop with 1,200 customers runs an analysis. 780 are active, 140 at risk and 280 inactive. The 280 inactive customers are the observed churn (780 + 140 + 280 = 1,200); the 140 at-risk customers are the indicator worth acting on this month. Sorting both groups by past spend shows which names matter most.
From Analysis to Churn Prevention
Churn prevention software is only useful if it leads to action. Use the at-risk list for timely reminders, and see at-risk customer detection for that early-warning workflow. For customers already past 90 days, see inactive customer detection.
Who Benefits
- Founders who want a clear churn figure without a data team
- E-commerce and B2B teams without subscription billing
- Teams reporting customer health to owners or investors
Frequently Asked Questions
Does Revenow predict churn with machine learning?
No. Revenow does not forecast churn with a predictive model. It measures what your purchase data already shows, using fixed day thresholds since each customer's last purchase.
What is the difference between a churn indicator and churn?
A churn indicator is a warning sign, such as a customer going 60 to 89 days without a purchase (at risk). Churn in Revenow's terms is a customer who has passed 90 days without buying (inactive). Even then, some inactive customers do return.
Can I do customer churn analysis without a subscription business?
Yes. Revenow works from order or transaction exports, so it suits stores and B2B sellers where customers simply stop reordering rather than cancelling a contract.
What does the churn analysis show?
How many customers are active, at risk and inactive, the estimated recoverable revenue from inactive customers, and the revenue at risk from customers who are overdue.
Will Revenow reduce my churn automatically?
No. It shows where churn is happening and who to prioritize. Any reduction comes from the actions your team takes.
Compare plans on the pricing page.